# Admin Dashboard
The Admin Dashboard provides a high-level overview of platform activity, learning content, and engagement metrics. It is designed to help administrators monitor platform health, learner progress, and potential issues requiring attention.
# 🧩 Dashboard Widgets
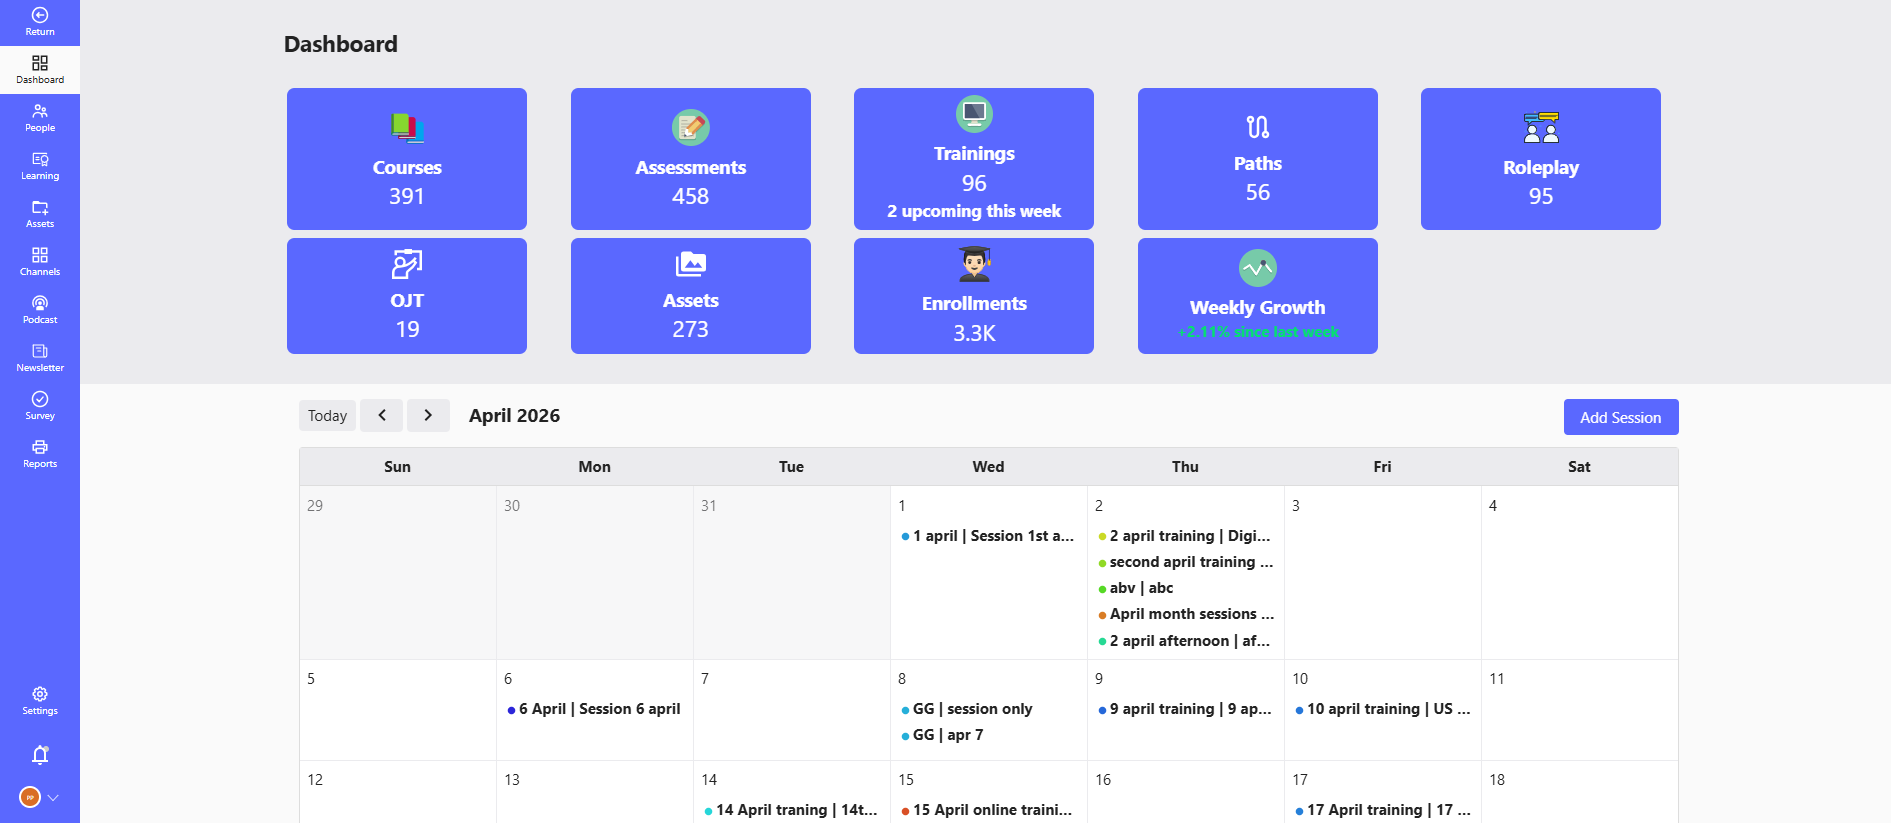
# 🔢 Overview Cards
Displays quick stats on key learning elements:
- Courses: Total number of published courses.
- Assessments: Count of available assessments.
- Trainings ILT: Total Instructor-Led Trainings scheduled.
- Paths: Count of learning paths defined.
- Roleplay: Number of available roleplay modules.
- OJT: On-the-job training modules
- Assets: Count of additional learning resources (PDFs, Docs, etc.).
- Enrollments: Total learner enrollments across all content.
- Weekly Growth: Percentage change in user engagement compared to the previous week.
# 📅 Calendar View
The Calendar View allows administrators to track and manage scheduled sessions.
# Key Features:
- Displays monthly view of all scheduled sessions
- Shows training titles, dates, and categories
- Quick navigation using previous / next month
- “Add Session” button to schedule new training directly
- Color indicators for different session types
# Benefits:
- Easy visibility of upcoming sessions
- Better planning and scheduling
- Avoid session conflicts
# 📈 Charts & Visualizations
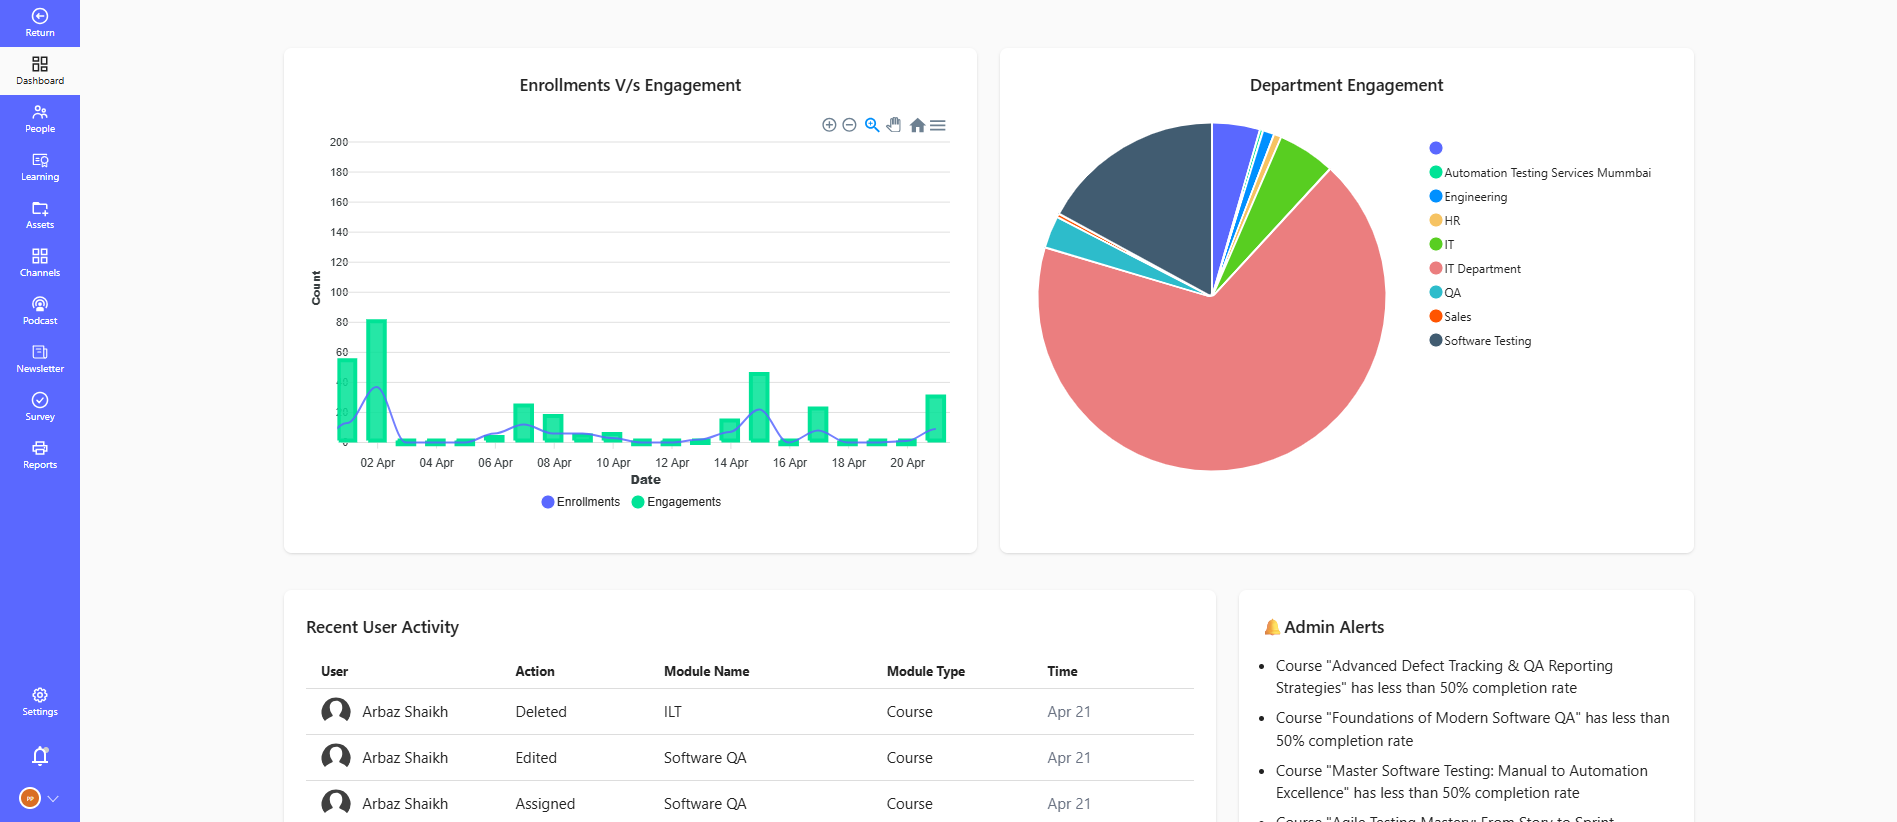
# 1. Enrollments vs Engagement
- Line + Bar chart comparing the number of content enrollments with actual user engagement over time.
- Useful for identifying drop-offs and content popularity.
# 2. Department Engagement
- Pie chart showing distribution of engagement across different departments or teams.
- Helps identify which teams are actively participating vs. those needing attention.
# 3. Recent User Activity
Table of the latest user actions:
- Includes user name, action type (Completed, Assigned, etc.), content name, content type, and timestamp.
- Useful for real-time visibility into learner behavior.
# 4. Admin Alerts
Displays critical platform alerts such as:
- Low attendance in ILT sessions
- Courses with less than 50% completion rate
- Warnings about inactive or low-engagement modules
These alerts help admins take immediate action to improve content effectiveness and learner participation.
# 🧠 Purpose
The dashboard serves as a real-time control panel for platform administrators to:
- Track platform usage trends
- Identify underperforming content
- Take corrective actions quickly
- Celebrate top-performing learners or departments