# Courses Report
The Courses Report in the admin dashboard provides a comprehensive overview of course-level engagement and completion statistics across the platform. It helps administrators monitor course performance, learner activity, and certification distribution.
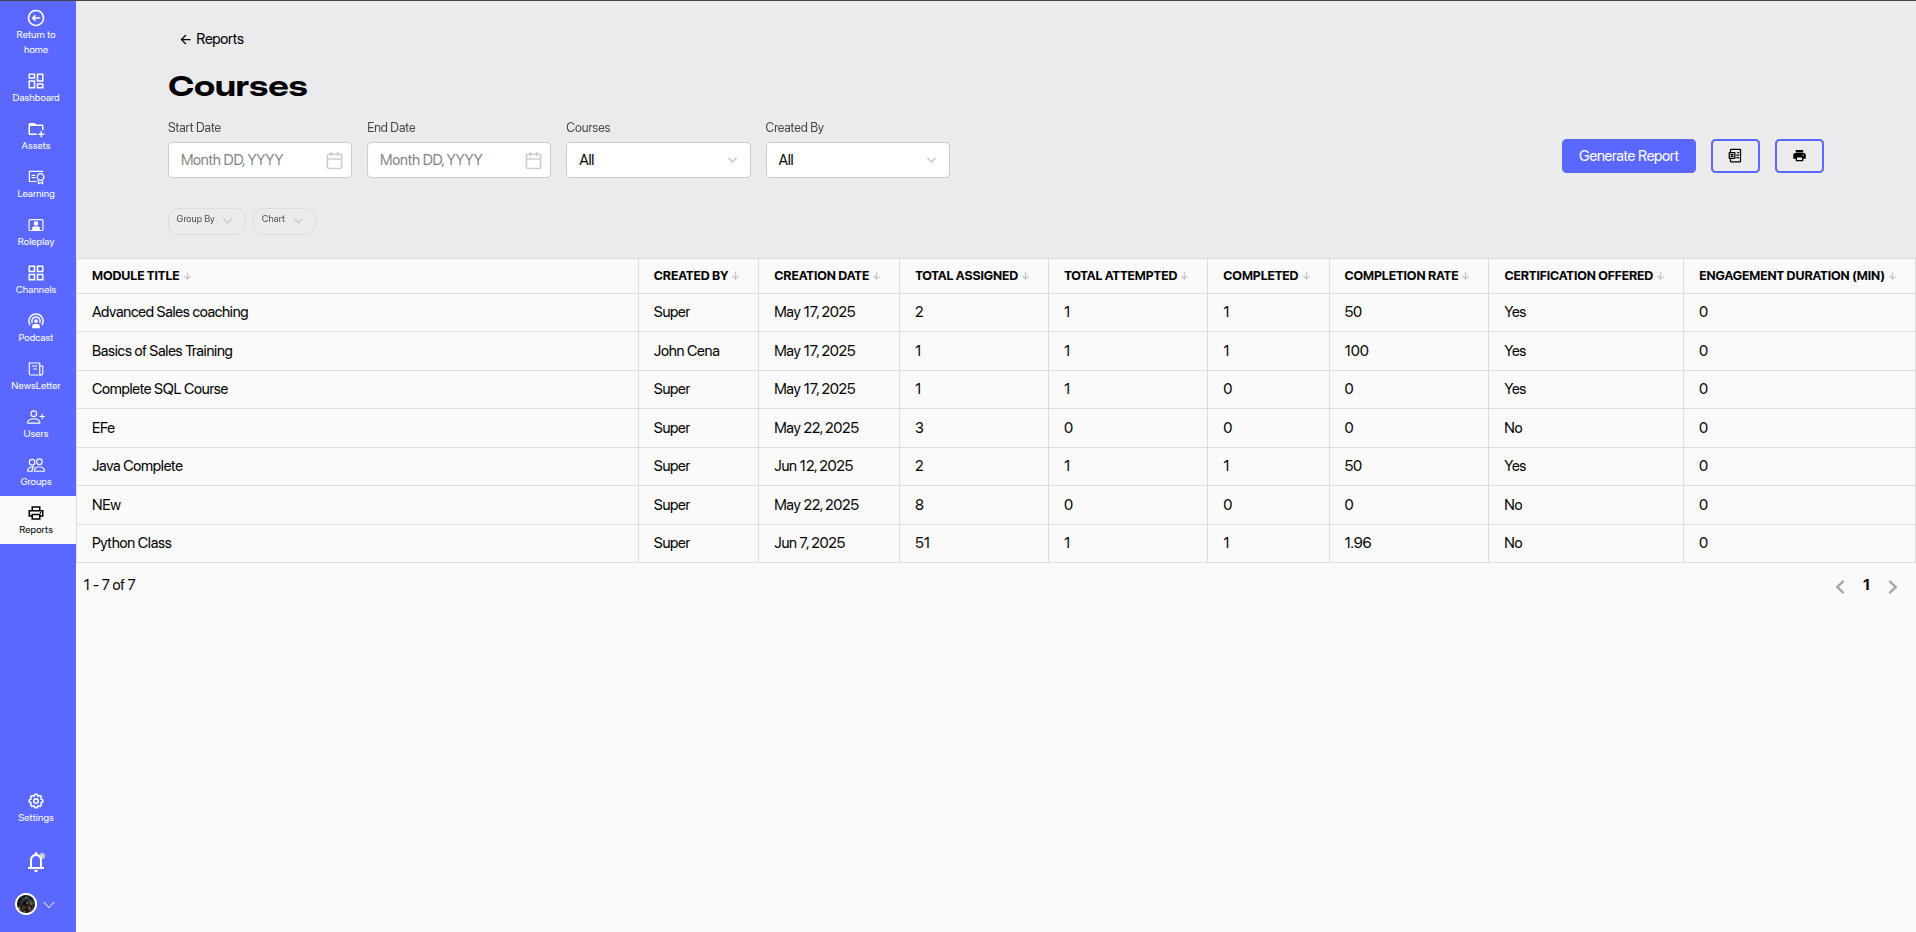
# 🔎 Report Filters
You can refine the report using the following filters:
- Start Date & End Date: Define the reporting time period.
- Courses: Select a specific course or view data for all courses.
- Created By: Filter courses based on the course creator.
Click Generate Report to apply the selected filters and view updated data.
# 📋 Report Columns
The following columns are displayed in the Courses Report table:
| Column | Description |
|---|---|
| Module Title | Title of the course/module. |
| Created By | Name of the user who created the course. |
| Creation Date | Date when the course was created. |
| Total Assigned | Number of users the course was assigned to. |
| Total Attempted | Number of users who started the course. |
| Completed | Number of users who completed the course. |
| Completion Rate (%) | Percentage of assigned users who completed the course. |
| Certification Offered | Indicates whether the course offers a certificate upon completion. |
| Engagement Duration (min) | Total duration (in minutes) that learners engaged with the course. |
# 📈 Features
- Group By / Chart View: Visualize data grouped by parameters such as creator, completion status, etc.
- Export & Print: Easily export the report data or print it for offline use.
- Pagination: Supports navigation through multiple pages of course data.
# 📌 Usage Tips
- Use this report to track course adoption and effectiveness across teams or departments.
- Monitor low engagement courses and take actions such as course improvements or additional training.
- Use completion and certification metrics to assess team learning progress.